TASK 13 / HTML · V1 · Data dashboard

Weather Dashboard

天气仪表盘

4 runs · 13.A.01 · HTML

Compare works →
TASK 13 · 13.A.01 · HTMLWeather Dashboard
Open independent copy ↗
Weather Dashboard

Preview note: Live weather requests may be unavailable; the artifact includes cached and offline fallbacks.

ORIGINAL PROMPT

Original prompt

PROMPT/Phase1_TEST_PROMPTS_BILINGUAL.md · The original prompt is kept verbatim

Source ↗
ORIGINAL PROMPT

Original prompt

Build a polished weather dashboard.

After implementing it:
1. Run the application.
2. Open it in the browser.
3. Inspect the rendered result yourself.
4. Fix any visual or functional issues you notice.
5. Repeat until you are satisfied.
TRANSLATION

Chinese translation

构建一个精致的天气仪表盘。实现后:1)运行应用;2)在浏览器中打开;3)自行检查渲染结果;4)修复发现的视觉或功能问题;5)重复上述过程,直到满意为止。

Expected outcome

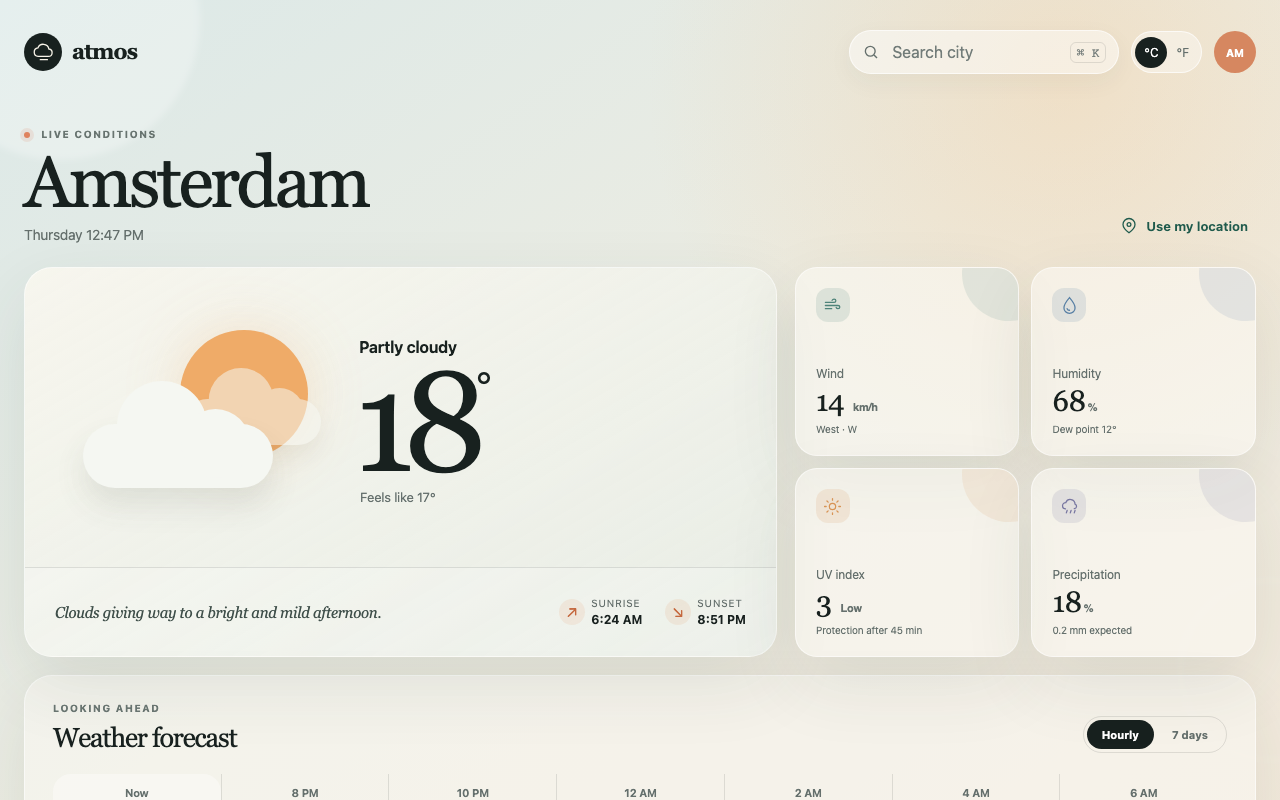
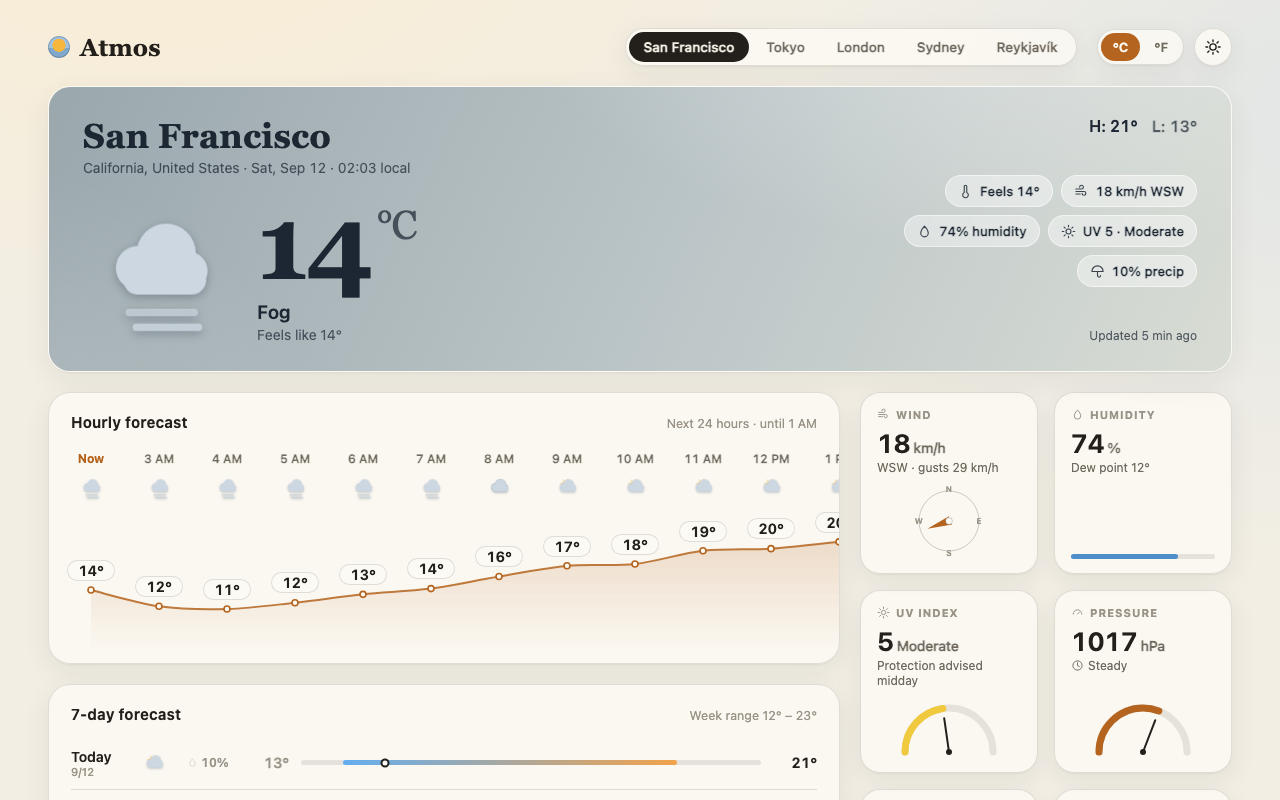
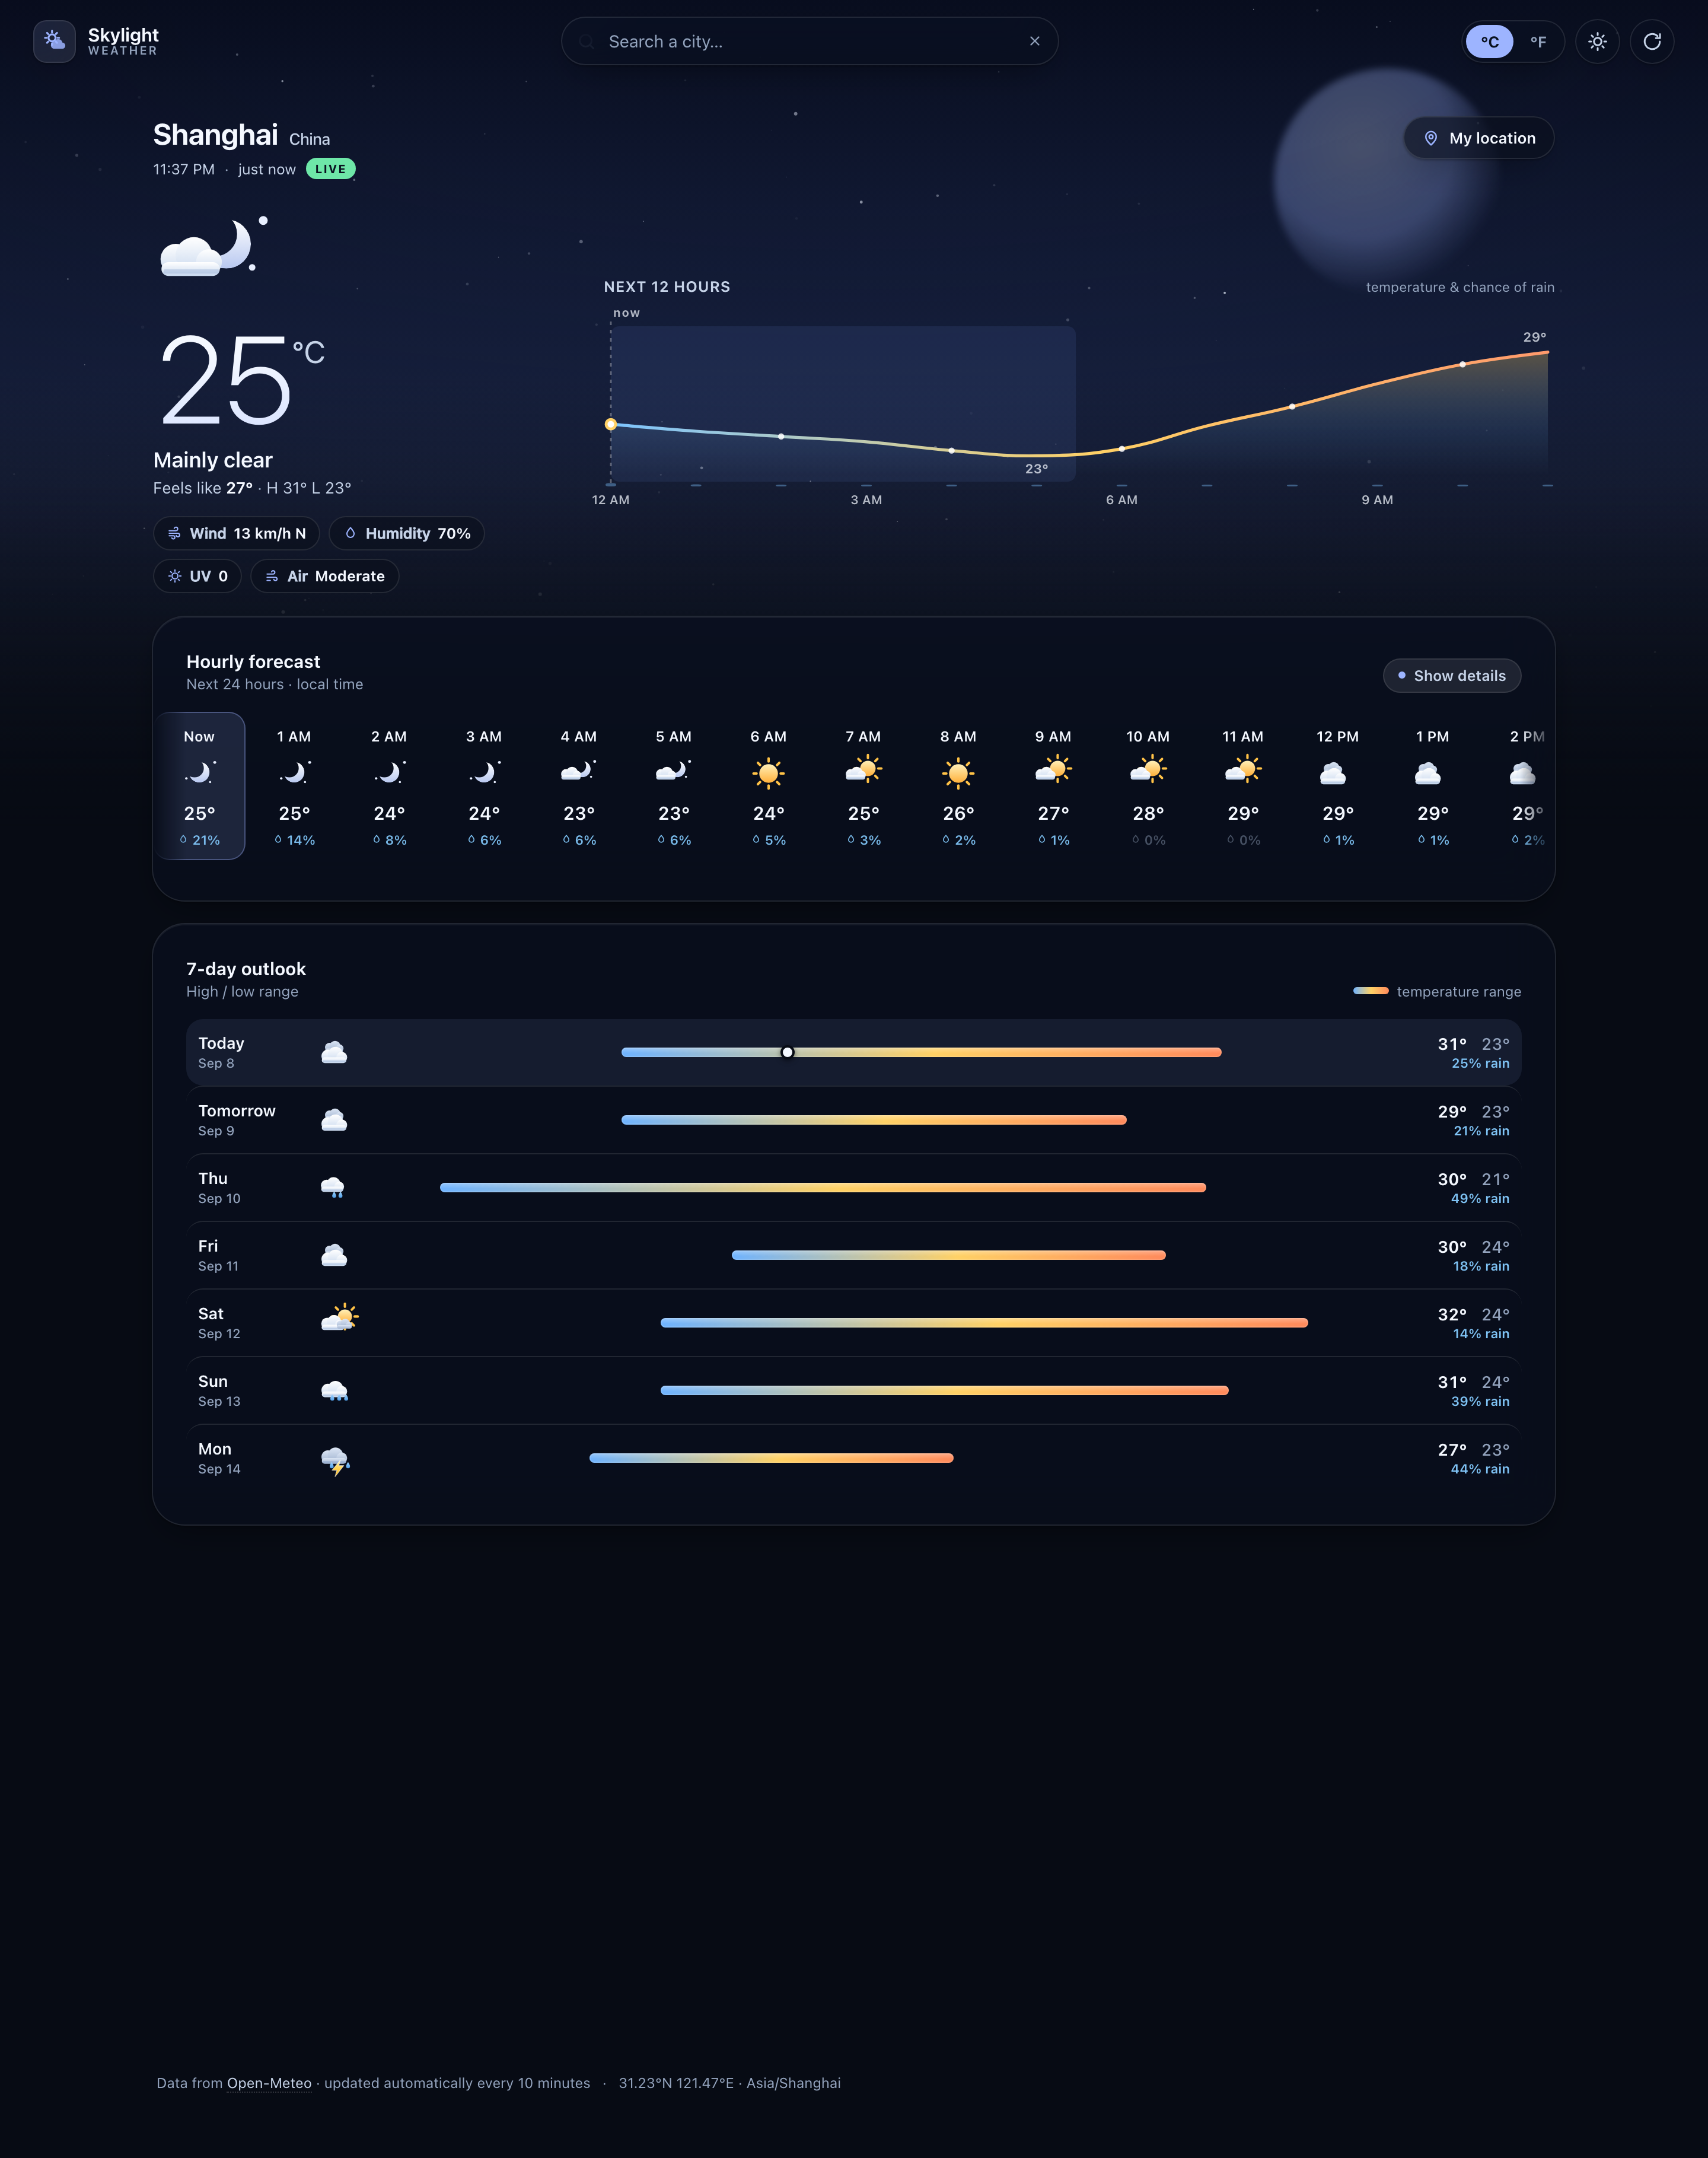
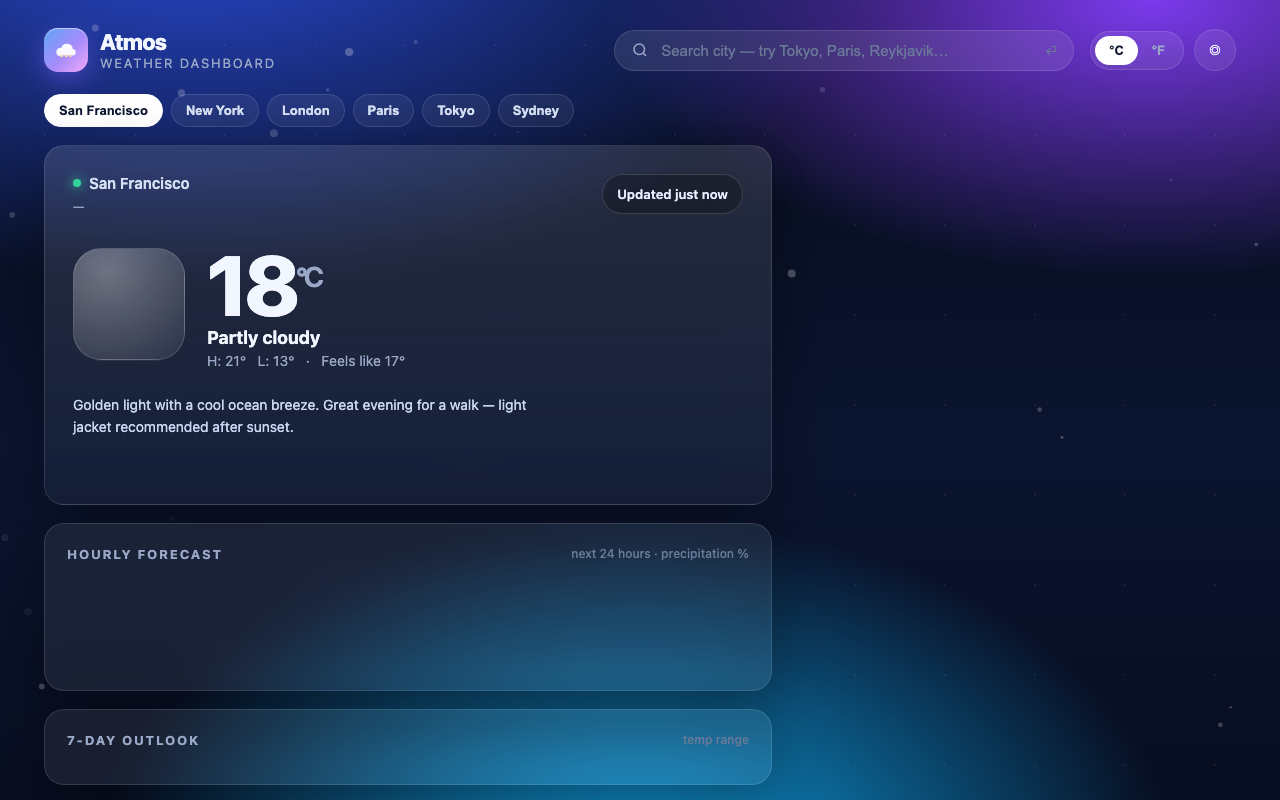
The deliverable should be a browser-run weather dashboard that has undergone repeated visual and functional self-review. It should clearly present location, current conditions, temperature, feels-like values, key metrics, and hourly or multi-day forecasts, with feedback for loading, failure, empty data, and refresh states. If live APIs are used, time zones, units, network timeouts, and missing fields must be handled correctly; offline behavior should be explicitly communicated. “Polished” should appear in the visual system, data hierarchy, weather-state presentation, responsive layout, interaction detail, accessibility, and absence of obvious rendering defects. The implementer is expected to inspect and repair the rendered app iteratively, not merely write code.

Additional verification guidance

  • Exercise successful load, loading, network failure, no-result, and cached/offline states in a real browser, ensuring clear and non-misleading feedback.
  • Test multiple time zones, midnight boundaries, Celsius/Fahrenheit, and wind and precipitation units for consistency across current, hourly, and daily views.
  • Review screenshots across phone, tablet, desktop, light/dark themes, and varied weather states for overflow, overlap, contrast, icon meaning, and chart sizing.
  • Exercise search, geolocation, unit switching, theme, refresh, and forecast details; check keyboard access, focus, ARIA state, reduced motion, and console errors.
THREE INTERPRETATIONS

Same task, three model interpretations

All three results use the same width and the same preview ratio; no model is marked as best.

COMPARISON METRICS

Comparison metrics

Cross-model comparison must note differences in harness, budget and isolation.

MetricDeepSeek-V4.1-Flashrun-deepseek-v4-1-flash-exp-0910-task-13-r1Muse Spark 1.3run-muse-spark-1-3-task-13-r1GPT-5.6 Solrun-gpt-5-6-sol-task-13-r1K3run-k3-task-13-r1
Runtime27:174:466:2951:23
API calls11130665
Tool calls13731581
Failures / retries9201
Token throughput12.7M840.3K190.4K5.7M
AI review90/10094/10060/10092/100
RUN RECORDS

Run records

Two runs of the same task version can be compared side by side.

13.A.01 · run-deepseek-v4-1-flash-exp-0910-task-13-r1DeepSeek-V4.1-Flash● Archived
Runtime
27:17
Token throughput
12.7M
API calls
111
View archive record →
13.B.01 · run-muse-spark-1-3-task-13-r1Muse Spark 1.3● Archived
Runtime
4:46
Token throughput
840.3K
API calls
30
View archive record →
13.C.01 · run-gpt-5-6-sol-task-13-r1GPT-5.6 Sol● Archived
Runtime
6:29
Token throughput
190.4K
API calls
6
View archive record →
RELATED TASKS

Related tasks

View all tasks →